FIXEdge C++/Java exports its performance metrics to Prometheus in real time.
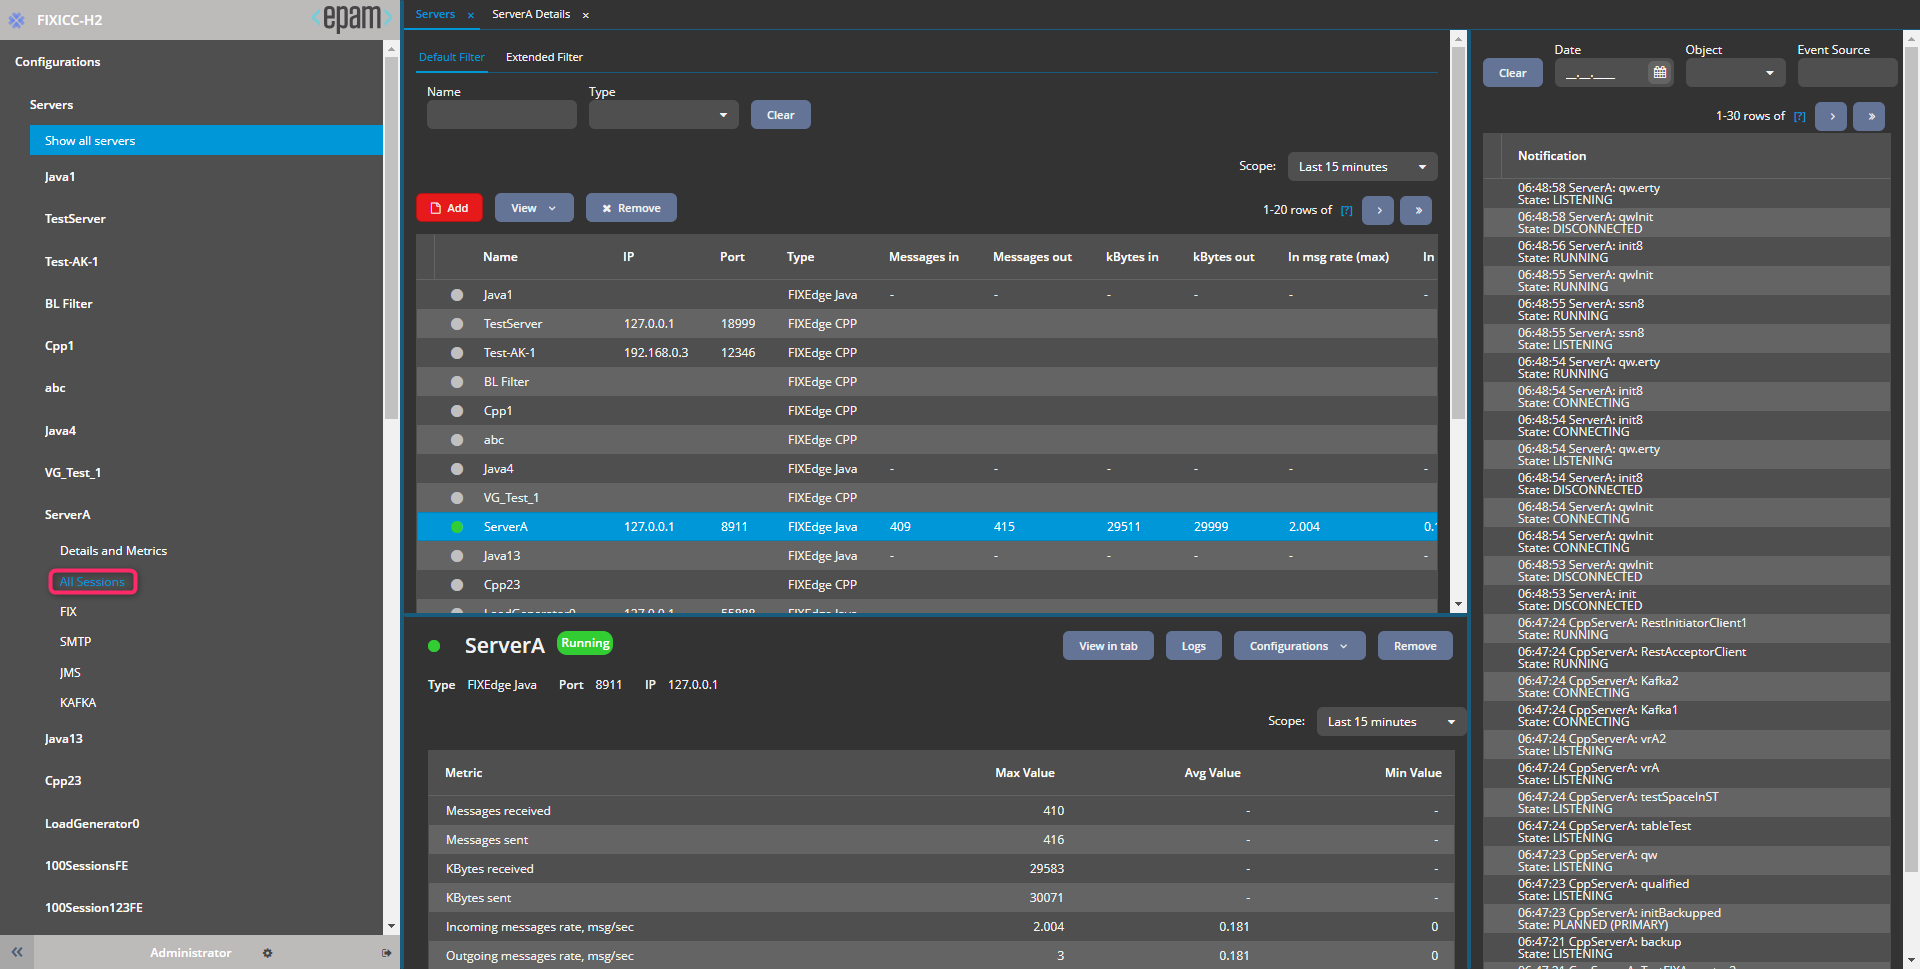
FIXEdge metrics cover the FIXEdge server, as well as individual connections (FIX & non-FIX):
- Send and receive data statistics, in message numbers and bytes
- Data transmission rates, in messages or bytes per second (or other time windows)
- Failure statistics, i.e., errors in routing rules, server,s and sessions downtime
- Latency statistics
- System stats, i.e., CPU load
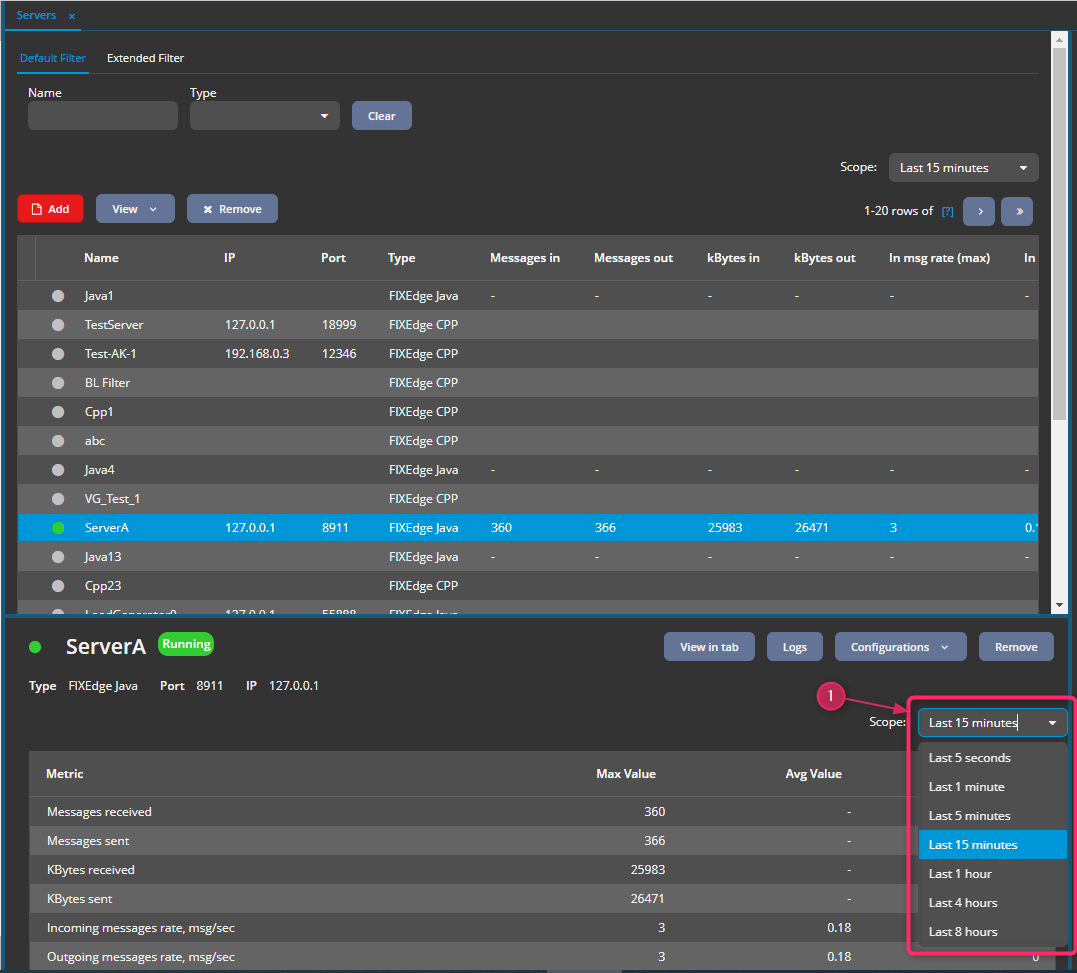
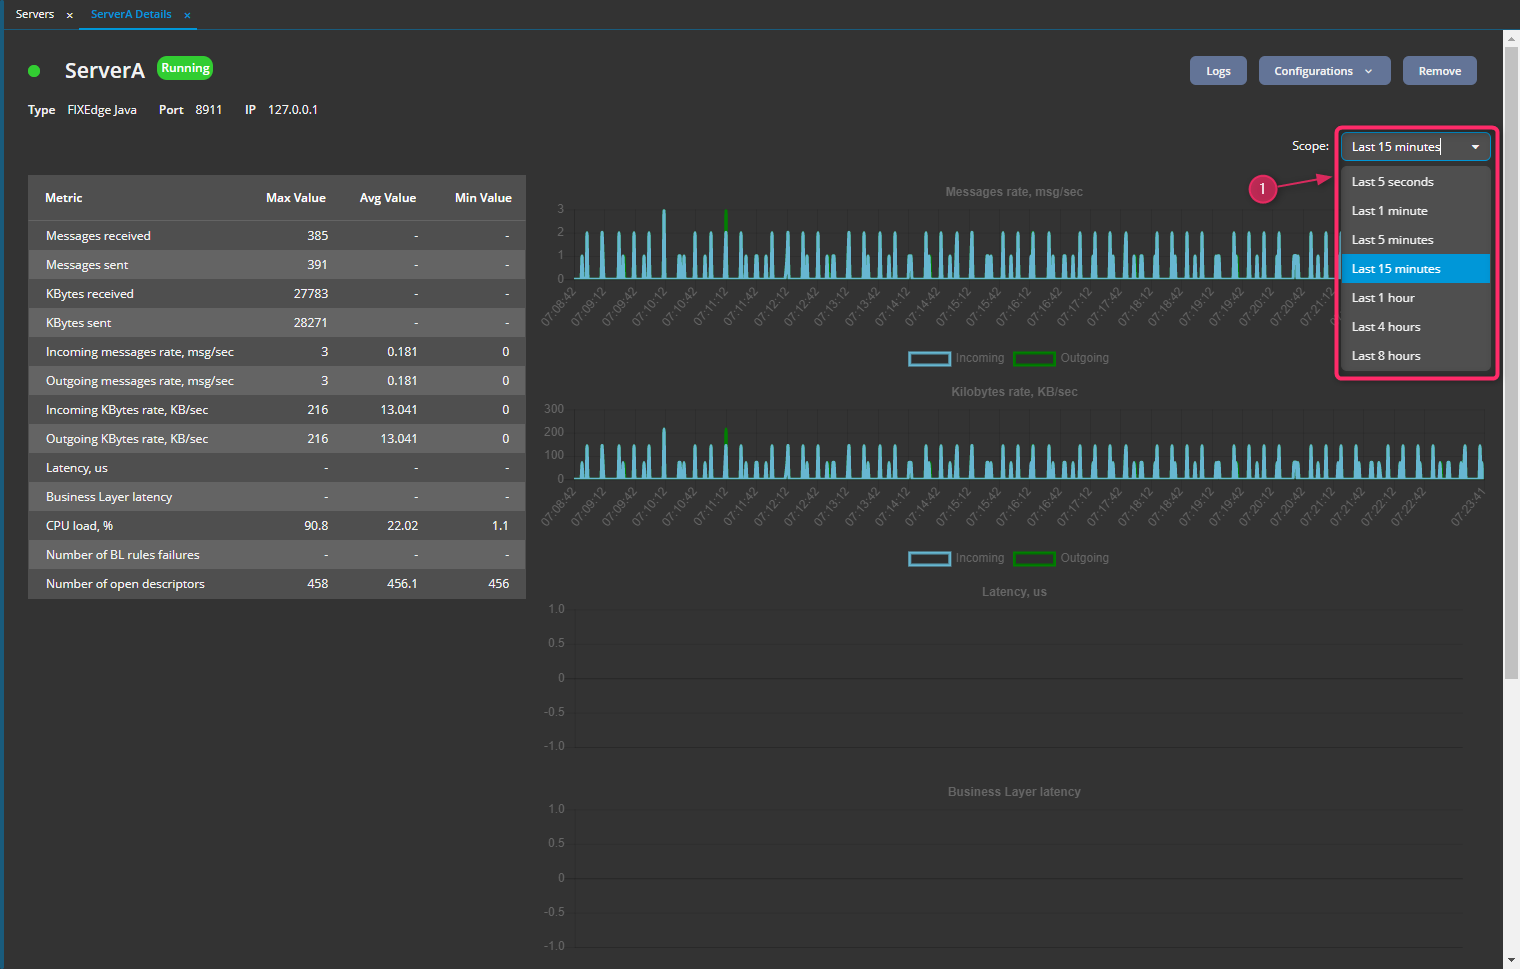
FIXICC H2 is integrated with Prometheus to provide a holistic view of FIXEdge administration and monitoring. H2 has pre-configured dashboards to display statistics for a select window of time in a tabular format, as well as historic charts to analyze trends and assist in capacity planning. We leverage the Prometheus API & PromQL to get time series data from long-term storage and build aggregations from them.
Since Prometheus is the de-facto industry standard, FIXEdge can be easily integrated to almost any monitoring & alerting system, whether it be open-source, commercial, self-hosted or cloud-based - like Grafana, AWS Cloud Watch, New Relic, and others.